This week I collaborated with my colleague, Tamás Gáspár to make you a great #WOW20 challenge. This challenge is based on a true story because this was a real claim from one of our clients. Let’s jump into it.
You can read the original requirements here: https://www.workout-wednesday.com/2020w29/
We used our favourite Superstore dataset that is located on your laptop under the Tableau Repository>Datasources Folder but you can download it here as well.
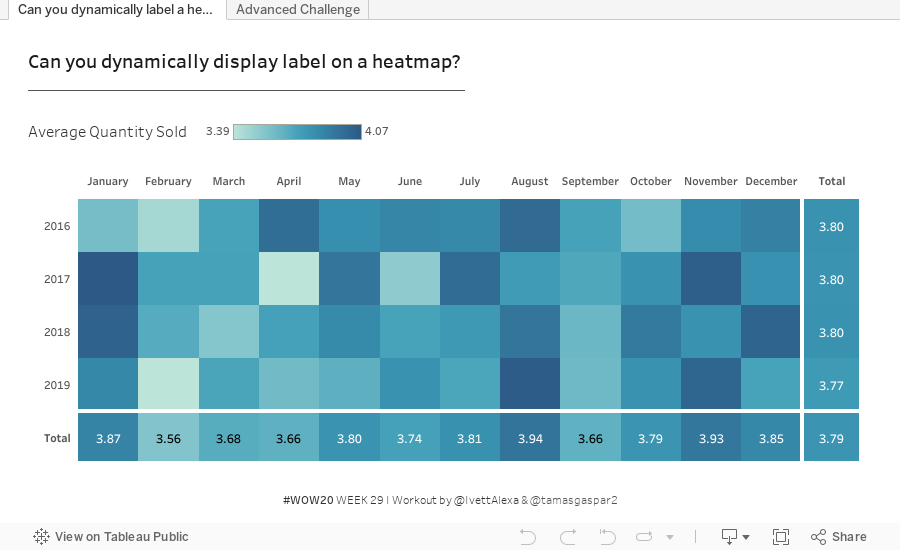
Goal:
- Have a heatmap where only the totals have labels.
- Show the cell value when the mouse is over it.
Guide
STEP #1: Prepare the date parts for the year and the month
- Order Month
datename(‘month’,[Order Date]) - Order Year
year([Order Date]) - Bring Month to the Column shelf with month date part and Year to the Rows as year.
- Add the average quantity to coloring.
Tip: Grab the field on the data pane with right-click and put on coloring. This will bring up the available aggregation for the field. Useful when you don’t want to use the default aggregation.

- Add Rows and Columns Totals.
- Set the coloring for the totals too. Right-click on the color card on the right, go to ‘Edit colors…’ then tick the ‘Include Totals’ checkbox.

STEP #2: Making Labels
- Now the first fun part. Making the label only for the total.
- Create 3 calculated fields.
Two are for differentiating normal cells and totals.
1. Row Size
size()
2. Column Size
size()
The third is to handle the different cells:
3. Label
if [row size] = 1
or [column size] = 1
then avg([Quantity])
End
- Now put the Label on the label mark
STEP#3: Set the chart type to Square
- The labels are looking weird, we need to set the table calculations. Right-Click on the Label and pick ‘Edit Table Calculation…’ At the top, ‘Nested Calculations’ drop-down pick ‘Row Size’ and select ‘Table (Across)’ computation. ‘Column Size’ needs to be set to ‘Table (Down)’. Now you should see the labels at the totals.
- Note: This method also can be used, when you have special logic for the total, or you just want something different with the totals.
STEP #4: Making label for the hovered cell
- We are going to use the Set Action function.
- Create 2 sets from the fields on the axes. Call them Hovered Month and Hovered Year.

STEP #5: Making the action to control the labels
- Put the sheet onto a dashboard.
- Go to the Dashboard menu and select Actions…
- Add Action and pick Change Set Values…
- Name it Hover Month. Set it to ‘Hover‘, pick the Hovered Month set, and set to Remove all values from set, when clearing selection.

- Do the same for the Year set.
- The final step is to add an exception to our Label field:
if [Row Size] = 1
or [Column Size] = 1
or (attr([Hovered Month])
and attr([Hovered Year]))
then avg([Quantity])
end
- One final thing, set the format of the label to 2 decimals and we are done!
![🙂]()

Advanced Challenge
Goal:
- Make the coloring dynamic. Have different metrics when a field is selected or not.
- Highlight the year and month of the selected cell.
STEP #1: Use our Basic for basis
STEP #2: Create 2 more sets for the selected cell
- Make the selected cell’s value available for the rest of the cells (I call it, projecting the value to all the data points).
I use window_max table calculation, but others are working fine too.
Picked year-month Value
window_max(
if attr([Selected Month])
and attr([Selected Year])
then avg([Quantity])
end
)
- Now we can make the difference calculation for the coloring and new label.
Coloring
AVG([Quantity]) – ifnull([picked year-month value],0)
STEP #3: Create the advanced label
if isnull([picked year-month value])
then if [Row Size] = 1
or [Column Size] = 1
or (attr([Hovered Month])
and attr([Hovered Year]))
then avg([Quantity])
End
elseif AVG([Quantity]) = ifnull([picked year-month value],0)
then AVG([Quantity])
else AVG([Quantity]) – ifnull([picked year-month value],0)
end
- Put Coloring to the Color mark and select Table (across then down) computation.
- Put Selected Label to the Label mark then Edit table calculation…
Row Size: Across
Column Size: Down
Selected year-month Value: Table (across then down)
STEP #4: Make the set and highlight actions
- Make 2 more set actions on the dashboard for the new selected sets, but now run the action on Select
- And finally, do the highlighting. We want to highlight the year and month where the selected cell is.
Create a new field.
Select Year or Month
[Selected Month]
or [Selected Year]
- Put it on the Details mark and select max aggregation.

- Now add the Highlight action through this field.
- Go to Dashboard and select Action…
- Add new Highlight action.
- Set to Selected Fields, and pick the max(Select Year or Month)
- Well Done, you have gone through a really long Workout Wednesday.
Now you know how to:
- Make custom totals.
- Create set action.
- Do nested table calculations.
- Project values to other data points.
- Make complex if statements.
That’s it! We hope you enjoyed reading the solution. Find & download the workbook on Tableau Public here:
If you have any questions, reach out to us on Twitter @IvettAlexa, @tamasgaspar2 !
The post Dynamic Label – Week29 Solution appeared first on DataViz.LoVe.